This guide aims to walk readers through the process of building a financial model from scratch. It covers essential steps such as gathering historical data, forecasting revenue, projecting expenses, and constructing financial statements. Whether you’re new to financial modeling or looking to enhance your skills, this article provides valuable insights into creating accurate and useful financial models. By following these steps, you’ll be well-equipped to develop robust models that drive better business decisions and financial planning.
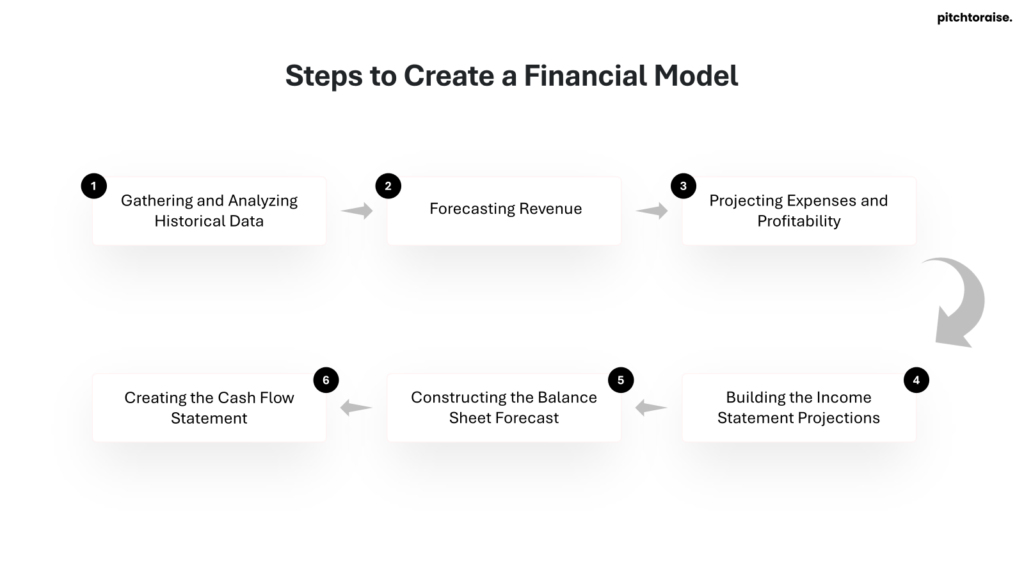
1. Gathering and Analyzing Historical Data
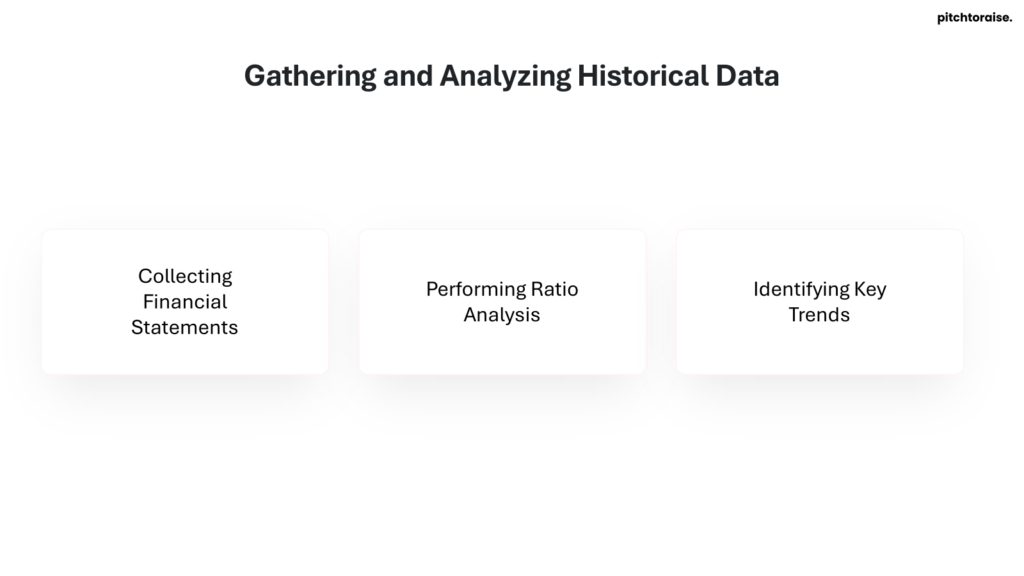
The foundation of a robust financial model lies in the thorough collection and analysis of historical data. This process involves gathering financial statements, performing ratio analysis, and identifying key trends that will inform future projections.
Collecting Financial Statements
The first step in building a financial model is to gather historical financial information. This typically involves obtaining the company’s income statement, balance sheet, and cash flow statement for several past periods [1]. These documents provide a comprehensive view of the company’s financial performance and position over time.
Once the financial statements are acquired, they need to be input into Excel or another spreadsheet software. This step requires careful attention to detail to ensure accuracy. After inputting the data, it’s crucial to format the information in a way that’s easy to read and aligns with the structure of the intended model [1]. This formatting not only enhances readability but also facilitates easier analysis and manipulation of the data in subsequent steps.
Performing Ratio Analysis
Ratio analysis is a cornerstone of fundamental equity analysis, offering valuable insights into a company’s financial health [2]. It involves examining various financial metrics to evaluate the company’s liquidity, operational efficiency, and profitability [2]. Some key ratios to consider include:
- Liquidity Ratios: These measure the company’s ability to meet short-term obligations. Examples include the current ratio and the acid-test ratio.
- Leverage Ratios: These assess the company’s debt levels, such as the debt-to-equity ratio .
- Efficiency Ratios: These evaluate how effectively the company uses its assets, like the inventory turnover ratio [2].
- Profitability Ratios: These gage the company’s ability to generate profits, such as the gross profit margin ratio [2].
- Market Value Ratios: These provide insight into how the market values the company .
By calculating these ratios, analysts can track the company’s performance over time and make comparative judgments against industry peers . This analysis helps in understanding the company’s financial strengths and weaknesses, which is crucial for accurate forecasting.
Identifying Key Trends
Trend analysis is a vital component of historical data examination. It involves looking at current trends to predict future ones, essentially a form of comparative analysis . When identifying key trends, analysts should focus on:
- Revenue and Cost Drivers: Understanding the fundamental drivers of the business is crucial for making accurate projections [1].
- Industry and Company-Specific Factors: Analyze how external factors like economic conditions and technological developments have impacted the company’s performance [1].
- Historical Performance Metrics: Calculate metrics such as revenue growth rates, profit margins, capital expenditures, and working capital terms [1].
- Market Trends: Examine how the company’s performance correlates with broader market or industry trends .
- Operational Efficiency: Look for trends in the company’s operational metrics, such as inventory turnover or accounts receivable days .
It’s important to note that while historical trends provide valuable insights, they should not be the sole basis for future projections. Unexpected events or changes in market conditions can disrupt established trends . Therefore, trend analysis should be combined with a thorough understanding of the company’s business model, management strategy, and external environment [1].
By meticulously gathering historical data, performing comprehensive ratio analysis, and identifying key trends, analysts lay a solid foundation for building accurate and reliable financial models. This process not only provides a clear picture of the company’s past performance but also offers crucial insights that will inform future projections and strategic decision-making.
2. Forecasting Revenue
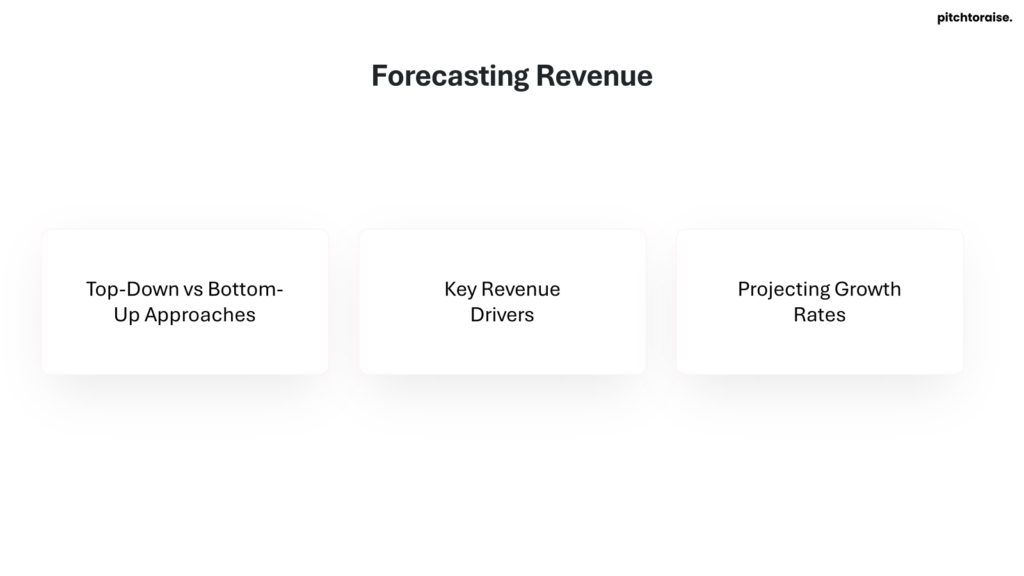
Forecasting revenue is a crucial step in building a financial model. It involves predicting future income based on historical data, market trends, and business drivers. This process helps companies plan for growth, allocate resources effectively, and make informed strategic decisions.
Top-Down vs Bottom-Up Approaches
When forecasting revenue, financial analysts typically use one of two main approaches: top-down or bottom-up.
The top-down approach starts with a high-level perspective and works its way down to specifics. It begins by considering factors such as:
- Historical company performance
- Industry growth rates
- Key economic indicators
This method provides a holistic view of how a company and its offerings fit into the larger industry picture [4]. It helps align goals and sales execution strategies with market demands and available opportunities. Companies use this approach to predict their potential market share and revenue based on the current state of the market [5].
In contrast, the bottom-up approach takes a more granular view. It starts at the ground level and builds up toward the overall financial outlook. This method focuses on:
- Product or service-specific details
- Customer segments
- Geographic regions
Bottom-up forecasting relies on the insights and expertise of employees directly involved in business operations [4]. It offers a detailed internal view of a company’s capability to compete with other market players and provides a realistic understanding of achievable benchmarks [5].
Key Revenue Drivers
Identifying and understanding key revenue drivers is essential for accurate forecasting. Business drivers are the inputs and activities that significantly impact a company’s operational and financial results [6]. Common examples include:
- Number of salespeople
- Number of stores
- Website traffic
- Number and price of products sold
- Units of production
To identify these drivers, analysts should perform a root cause analysis, starting with the company’s financial statements and asking, “What drives this line item?” [6]. For instance, in a brick-and-mortar retail business, revenue might be driven by:
- Volume of products sold × Average price
- Number of products × Number of salespeople
- Number of stores × Store sizes
Understanding these drivers allows for more accurate projections and helps in monitoring the effectiveness of different strategies, such as adding new stores, increasing salespeople, or adjusting prices [6].
Projecting Growth Rates
Growth rates are a critical component of revenue forecasting. They represent the percentage change of a specific variable within a given time period and can be positive or negative [7]. When projecting growth rates, consider the following:
- Historical Performance: Analyze past growth rates for the company and its various segments or product lines [8].
- Industry Benchmarks: Each industry has unique benchmark growth rates against which performance is measured [7].
- Market Conditions: Consider economic conditions, technological developments, and other external factors that may impact growth [6].
- Company-Specific Factors: Take into account the company’s expansion plans, new product launches, or changes in strategy [8].
- Geographic Considerations: For companies expanding globally, project revenue by geography to account for regional differences in growth potential [8].
When projecting growth rates, it’s important to break down revenue into its components rather than simply assuming an overall growth rate based on historical financials [8]. For companies with multiple products or business segments, projecting individual business lines can provide more accurate results. For example, a company like Apple may experience higher growth in iPhones and services compared to its iPod segment [8].
For companies with store expansion plans, projecting store growth and average sales per store can yield more precise revenue forecasts [8]. Similarly, for businesses expanding globally, projecting revenue by geography can account for varying growth rates in different regions [8].
Once growth rates are projected, it’s crucial to compare the output with management’s guidance and analyst estimates. This comparison helps validate assumptions and identify potential discrepancies [8]. The ability to derive and defend these assumptions is key to becoming a top financial analyst.
By carefully considering these factors and approaches, financial analysts can create more accurate and reliable revenue forecasts, providing a solid foundation for the entire financial model.
3. Projecting Expenses and Profitability
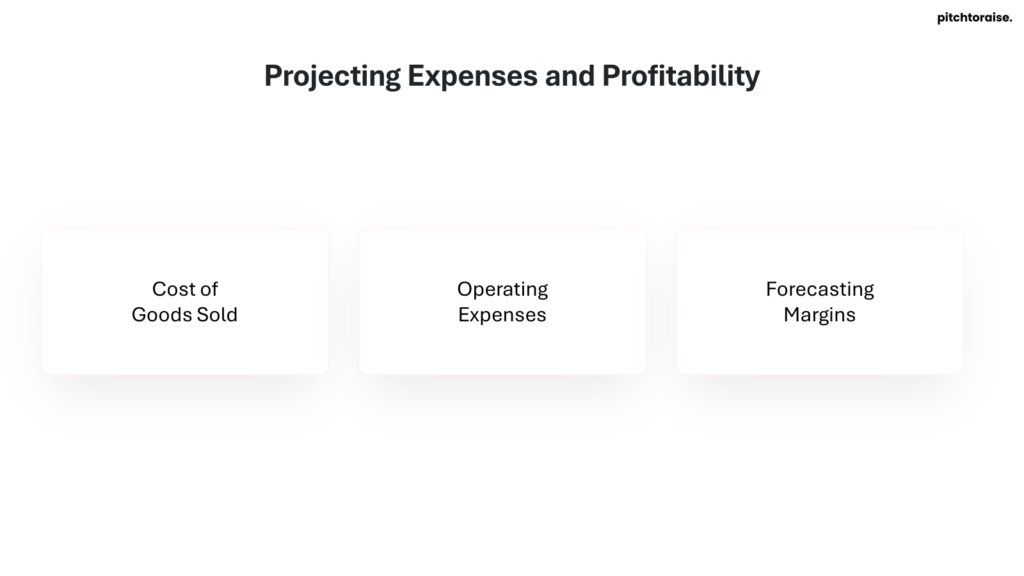
Cost of Goods Sold
Projecting the Cost of Goods Sold (COGS) is a crucial step in building a financial model. COGS includes raw materials, direct labor, and overhead costs used in producing goods [9]. Analysts typically forecast COGS as a percentage of sales, using historical data as a starting point for estimates [9]. This method, known as the percentage of sales revenue method, is simple and effective for most models [10].
To calculate COGS, analysts can subtract it from revenue to find Gross Profit, or alternatively, forecast Gross Profit and then mathematically derive COGS [10]. It’s important to note that since COGS is a relatively high cost, even a small error in this item can significantly impact the forecasted operating profit [9].
For a more robust model, analysts may choose to break down COGS into specific components such as:
- Raw materials
- Work in progress
- Finished goods
- Labor costs
- Direct material costs
These components can be forecast individually, either as percentages of sales revenue or using whole dollar values, depending on the nature of the business operations [10].
When projecting COGS, analysts should consider several factors:
- Analyzing costs by segment, product, volume, and price components to improve forecasting accuracy [9]
- The impact of fluctuating input costs and the company’s ability to pass these on to customers [9]
- The company’s hedging strategy, which can be found in the footnotes of the annual report [9]
- Competitors’ gross margins as a benchmark, while accounting for differences in business models [9]
Operating Expenses
Operating expenses, particularly Selling, General, and Administrative (SG&A) expenses, have a less direct relationship with a company’s revenue compared to COGS [9]. A simple approach is to forecast total SG&A as one line item using the percentage of sales method [10]. However, for a more detailed model, breaking out SG&A into individual components can provide greater accuracy.
When forecasting individual SG&A components, consider the following:
- Selling and distribution expenses: These have a significant variable component and can be estimated as a percentage of sales [9].
- General and administrative expenses: These include employee overhead and research and development costs, which have a lesser degree of variability [9].
- Fixed expenses: Some costs, like rent, are generally fixed and should be forecast as a fixed dollar value rather than a percentage of sales [10].
- One-off expenses: These do not appear every month and require special consideration [10].
To benchmark a company against its competitors, analyze the historical relationship between sales and operating expenses [9]. This analysis can provide insights into a company’s efficiency and margin potential compared to its peers.
Forecasting Margins
Forecasting margins is essential for understanding a company’s profitability. The operating margin, also known as the return on sales (ROS), is a key metric that measures how much profit a company makes on a dollar of sales after paying for variable costs of production but before paying interest or tax [11].
To calculate the operating margin:
- Determine the operating income (EBIT) by subtracting COGS and operating expenses from revenue.
- Divide the operating income by net sales.
- Express the result as a percentage.
For example:
Revenue: $10 million
COGS: $4 million
Operating expenses: $2 million
Operating Profit (EBIT) = $10 million – $4 million – $2 million = $4 million
Operating Margin = $4 million ÷ $10 million = 40% [12]
Higher operating margins are generally better, indicating that the company is efficient in its operations and good at turning sales into profits [11]. When forecasting margins, consider the following:
- Industry benchmarks and competitive landscape
- Historical performance and trends
- Potential for economies of scale as the business grows
- Impact of operational improvements or cost-cutting measures
It’s important to note that operating margins should only be compared between companies in the same industry with similar business models and annual sales [11]. For a more comprehensive analysis, consider using EBITDA (Earnings Before Interest, Taxes, Depreciation, and Amortization) to eliminate the effects of financing, accounting, and tax policies [11].
By carefully projecting expenses and profitability, analysts can create a more accurate financial model that provides valuable insights into a company’s future performance and financial health.
4. Building the Income Statement Projections
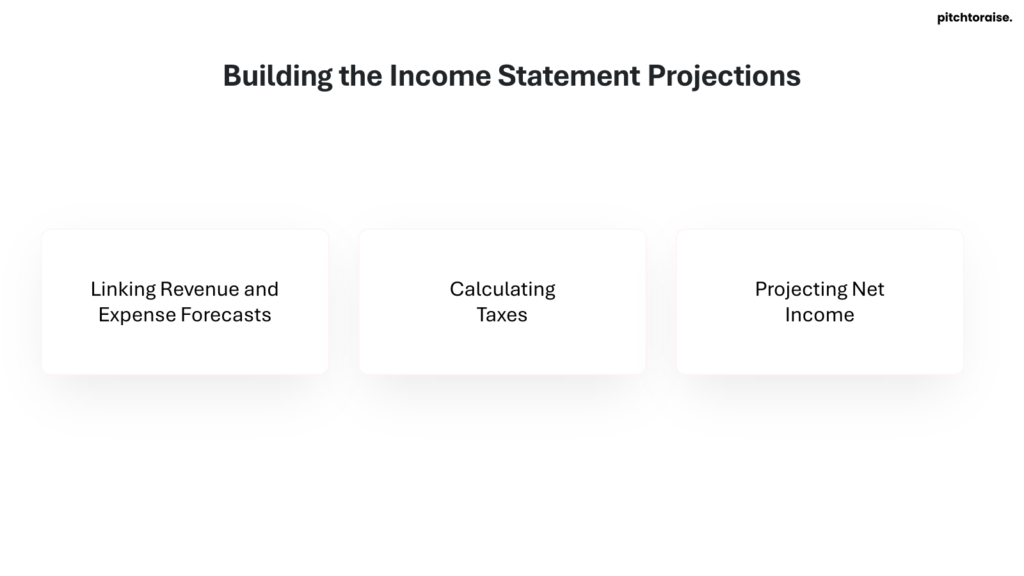
Linking Revenue and Expense Forecasts
Building a comprehensive income statement projection begins with forecasting sales revenue, which serves as the foundation for subsequent line items [10]. Analysts can employ various methods to project revenue, including:
- Simple growth rate: Multiplying the previous year’s revenue by one plus the growth rate.
- Macroeconomic pegging: Using a regression formula based on historic sales revenue and macroeconomic indicators like GDP.
- Fixed dollar value: A quick but less accurate method for rough estimates.
When forecasting revenue, it’s crucial to examine historical trends, recent quarterly reports, and management guidance [13]. Small variances in top-line growth can significantly impact earnings per share (EPS), cash flows, and stock valuation [13].
After projecting revenue, analysts can forecast expenses using the percentage of sales method or by breaking down individual components [10]. For instance, Cost of Goods Sold (COGS) can be estimated as a percentage of sales revenue based on historical data [10]. Selling, General, and Administrative (SG&A) expenses can be projected as a total or broken down into individual components, depending on the model’s complexity [10].
When forecasting expenses, it’s important to consider:
- Fixed vs. variable costs
- Historical trends in dollar amounts and proportions of revenue
- Management guidance and business outlook [13]
For example, if SG&A expenses have historically ranged between 8% and 10% of revenue, future projections should likely fall within this range [13]. However, rapid business growth might lead to lower SG&A proportions due to fixed costs being spread over a larger revenue base [13].
Calculating Taxes
Incorporating taxes into income statement projections is a critical step that impacts the company’s overall financial picture. To accurately calculate taxes, analysts should follow these steps:
- Determine taxable income: Subtract allowable deductions and expenses, including operating costs, depreciation, and interest expenses, from the business’s gross income [14].
- Apply the appropriate tax rate: Use the applicable income tax rate for the business to calculate the income tax expense [14].
- Consider deferred taxes: Account for deferred tax assets and liabilities, which can impact future cash flows [15]. Increases in deferred tax assets are added back to net income, while increases in deferred tax liabilities are deducted [15].
- Calculate operating cash flow: Use the formula: Operating Cash Flow = EBIT + Depreciation – Taxes, where EBIT refers to earnings before interest and taxes [15].
It’s important to note that tax planning can significantly impact a company’s cash position [15]. Factors to consider include:
- Income tax, indirect tax, and potential tax benefits
- The impact of tax policies on capital asset depreciation
- The effect of net operating losses or unused tax credits on future tax liabilities [15]
Projecting Net Income
To project net income, analysts must consider all the previously forecasted line items and make any necessary adjustments. The process typically involves:
- Subtracting projected expenses from projected revenue to determine operating profit [10].
- Accounting for non-operating expenses, such as interest expense for industrial companies [13].
- Deducting the calculated tax expense from operating profit [16].
- Considering any additional factors that may impact net income, such as extraordinary items or discontinued operations.
Once net income is projected, analysts can calculate earnings per share (EPS) by dividing the forecasted net income by the projected number of outstanding shares [16]. EPS projections are crucial for equity valuation and generating target prices for stocks [13].
It’s essential to review the quality of assumptions and make necessary adjustments throughout the forecasting process [16]. By carefully linking revenue and expense forecasts, accurately calculating taxes, and projecting net income, analysts can create a robust income statement projection that provides valuable insights into a company’s future financial performance.
5. Constructing the Balance Sheet Forecast
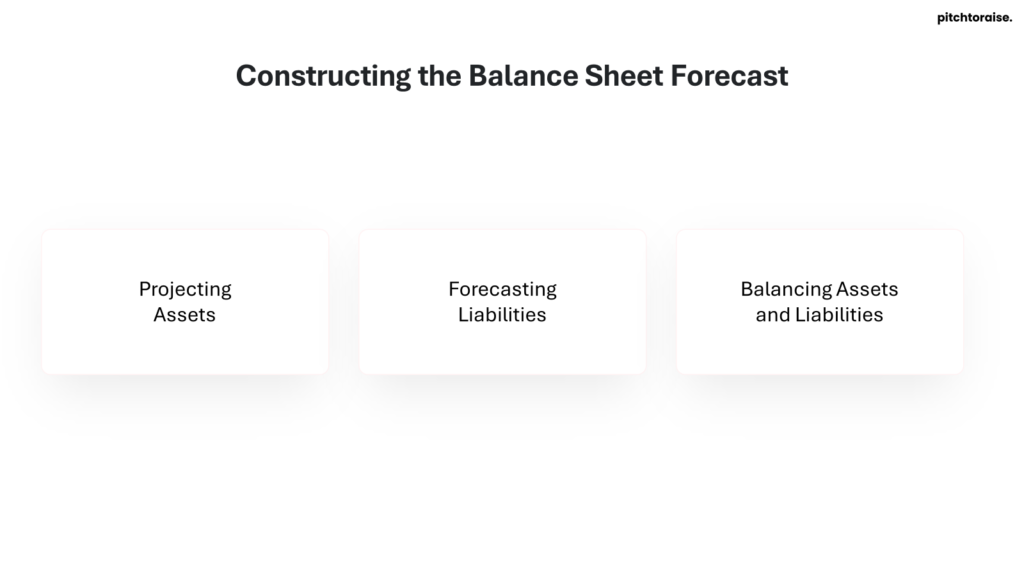
Constructing a balance sheet forecast is a crucial step in financial modeling, providing a projection of a company’s future financial position. This process involves estimating future assets, liabilities, and equity based on historical data, strategic goals, and financial trends [17]. To create an accurate and useful balance sheet forecast, analysts should follow best practices and use a structured approach.
Projecting Assets
The first step in constructing a balance sheet forecast is projecting assets. This process begins with gathering at least two years of historical balance sheet data to provide context for future projections [18]. Analysts should input this data into Excel, organizing it in columns with time progressing from left to right [17].
When projecting assets, it’s essential to focus on the main drivers for each asset category. For instance:
- Accounts Receivable: This is typically driven by sales growth and payment terms [17].
- Inventory: Projections depend on production plans and sales forecasts [17].
- Property, Plant, and Equipment (PPE): Forecast by adding expected capital expenditures to current PPE, subtracting projected depreciation, and accounting for any asset disposals or acquisitions [17].
For long-term assets, the largest components are usually fixed assets, intangible assets, and capitalized software development costs [18]. These items are primarily driven by the company’s operations [18].
It’s important to note that some asset items may require special treatment:
- Goodwill is typically straight-lined in a 3-statement financial model. For example, if goodwill on the latest balance sheet is $400 million, it stays at $400 million indefinitely [18].
- Deferred taxes are complex and are often either grown with revenue or straight-lined in the absence of a detailed analysis [18].
- “Other” assets, if not well-defined in footnotes, should be straight-lined rather than grown with revenue [18].
Forecasting Liabilities
Forecasting liabilities follows a similar process to projecting assets. Key considerations include:
- Accounts Payable: Analyze historical payment cycles, consider changes in purchasing policies, and adjust for expected variations in the cost of goods or services [17].
- Long-term Debt: Companies often provide footnote disclosures of future debt maturities. Use this information to project debt repayments accurately [18].
For long-term debt, analysts can either hold the balance constant or grow it at the same rate as the company’s net income. The latter approach ties debt to equity growth by using net income as a proxy for equity growth [18].
When forecasting liabilities, it’s crucial to create detailed schedules for each component, such as payables and debt. These schedules should host the calculations and assumptions underlying the forecast, providing a clear audit trail and making adjustments easier [17].
Balancing Assets and Liabilities
The final step in constructing a balance sheet forecast is ensuring that assets equal liabilities plus equity. This balance is crucial for the accuracy and reliability of the forecast [18]. To achieve this balance:
- Integrate with Income Statement: Forecast the income statement first to determine net income, which affects retained earnings on the balance sheet [17].
- Consider Cash Flow Impacts: Forecast the cash flow statement to highlight changes in cash and cash equivalents, linking operational activities with financial outcomes [17].
- Use Dynamic Formulas: Employ Excel formulas to ensure the model is dynamic and can adjust as assumptions or input data change. Functions like VLOOKUP, INDEX(MATCH), and SUMIFS can be particularly useful [17].
- Implement Consistency Checks: Create checks to ensure the balance sheet balances at all times. Any discrepancies indicate errors in forecasting or data input that need to be resolved [17].
Common reasons for an unbalanced forecast include:
- Switched signs (+/-) for items like capital expenditures
- Mislinks in formulas
- Cash flow statement errors, such as forgetting to include the cash impact of changes in other long-term assets [18]
By following these steps and best practices, analysts can construct a robust balance sheet forecast that provides valuable insights into a company’s future financial position. This forecast serves as a crucial tool for decision-making, helping project sponsors, lenders, and investors evaluate the financial viability of projects and make informed choices about investments and resource allocation [19].
6. Creating the Cash Flow Statement

The cash flow statement is a crucial financial document that provides insights into a company’s cash inflows and outflows over a specific period. It consists of three main sections: cash from operations, cash from investing, and cash from financing. By forecasting these components, analysts can derive a comprehensive view of a company’s future cash position.
Cash from Operations
Cash flow from operating activities represents the total amount of cash generated from a company’s core business operations [20]. To calculate this, analysts start with net income from the income statement and make several adjustments:
- Add back non-cash expenses: Items like depreciation and amortization are added back as they don’t represent actual cash outflows [20].
- Account for changes in working capital: Adjustments are made for changes in current assets and liabilities [20].
The formula for cash flow from operations can be expressed as:
Cash Flow from Operations = Net Income + Non-Cash Expenses +/- Changes in Working Capital [20]
It’s important to note that changes in working capital have specific effects on cash flow:
- An increase in current assets (e.g., accounts receivable, inventory) decreases cash flow
- A decrease in current assets increases cash flow
- An increase in current liabilities (e.g., accounts payable) increases cash flow
- A decrease in current liabilities decreases cash flow [20]
Cash from Investing
Cash flow from investing activities primarily focuses on the acquisition and disposal of long-term assets. In most financial models, the main component of this section is capital expenditures (CAPEX) [21]. To forecast cash from investing:
- Analyze the company’s fixed asset or property, plant & equipment (PP&E) forecasts
- Consider any planned asset disposals or acquisitions
- Calculate the cash outflow for CAPEX based on the company’s growth plans and historical trends [21]
It’s worth noting that fully depreciated assets disposed of typically don’t generate cash flows, so they may not be included in this section [21].
Cash from Financing
Cash flow from financing activities includes transactions related to debt, equity, and dividends. To forecast this section:
- Compare the forecast year with the prior year for most financing items
- Include cash flows related to:
- Issuance or repayment of debt
- Issuance or repurchase of equity
- Payment of dividends [21]
It’s important to note that some organizations may include dividend cash flows in operating activities, so analysts should align their approach with the company’s financial reporting practices [21].
By combining these three components, analysts can derive the forecast net cash movement for the company. This forecast is valuable for various purposes, including:
- Predicting future cash positions
- Avoiding cash shortages
- Planning for debt repayments and interest payments
- Ensuring compliance with debt covenants
- Supporting growth strategies [22]
For equity valuation purposes, analysts often use the concept of Free Cash Flow to the Firm (FCFF) or Unlevered Free Cash Flow. The formula for FCFF is:
FCFF = EBIT * (1 – Tax Rate) + Depreciation & Amortization – Net Capital Expenditures – Increase in Net Working Capital [21]
This measure provides a more comprehensive view of the cash available to all stakeholders, including debt holders and equity investors.
In conclusion, creating an accurate cash flow statement forecast requires careful analysis of historical data, consideration of future business plans, and a thorough understanding of the interrelationships between various financial statement components. By mastering this process, financial analysts can provide valuable insights into a company’s future financial health and support informed decision-making.
Conclusion
Building a financial model from scratch is a powerful skill that has a significant impact on business decision-making and strategic planning. This guide has walked through the essential steps, from gathering historical data to constructing detailed financial statements. By following these methods, analysts can create robust models that offer valuable insights into a company’s financial health and future prospects.
To wrap up, mastering financial modeling opens doors to better financial planning and more informed investment choices. The process of creating these models helps to deepen understanding of business operations and financial dynamics. As you put these techniques into practice, remember that the true value of a financial model lies in its ability to adapt to changing circumstances and provide actionable insights for real-world decision-making.
FAQs
1. How do I start building a financial model from the ground up?
To construct a financial model from scratch, follow these six essential steps:
- Gather Historical Data: Collect at least three years of the company’s financial history.
- Calculate Ratios and Metrics: Use the historical data to calculate key financial ratios and metrics.
- Make Informed Assumptions: Base your projections on realistic and informed assumptions.
- Create a Forecast: Develop financial forecasts using the data and assumptions.
- Value the Company: Estimate the company’s value based on your model.
- Review: Carefully review and refine the model as needed.
2. What is the best way to learn financial modeling on my own?
To teach yourself financial modeling, you might follow these steps:
- Past Financial Data and Assumptions: Start with collecting and analyzing past financial data.
- Income Statement: Begin modeling with the income statement.
- Balance Sheet: Then, move on to the balance sheet.
- Supporting Schedules: Develop detailed supporting schedules.
- Complete Financial Statements: Ensure that the balance sheet and income statement are complete.
- Cash Flow Statement: Prepare the cash flow statement.
- DCF Analysis: Conduct Discounted Cash Flow (DCF) analysis.
- Sensitivity and Scenario Analysis: Perform sensitivity and scenario analyzes to test the model’s robustness.
3. How much time is required to develop a financial model from scratch?
The time needed to build a financial model varies significantly depending on its complexity. More intricate models might take several months, while simpler, high-level models based on estimates could be completed in just a few days.
4. What are the ten steps to building a financial model?
Here is a step-by-step guide to crafting a financial model:
- Define the Model’s Purpose: Clearly state what you want to achieve with the model.
- Gather Relevant Data: Collect all necessary data that will inform your model.
- Create Assumptions: Formulate assumptions that will drive your forecasts.
- Build the Income Statement: Construct the income statement as part of the model.
- Build the Balance Sheet: Develop the balance sheet.
- Develop the Cash Flow Statement: Prepare the cash flow statement.
- Perform Sensitivity Analysis: Analyze how different variables affect the model’s outcomes.
- Review and Refine: Continuously review and improve the model to ensure accuracy and relevance.
